Go Struct Padding, and the 2% I Fought For
Why I was looking at memory in the first place
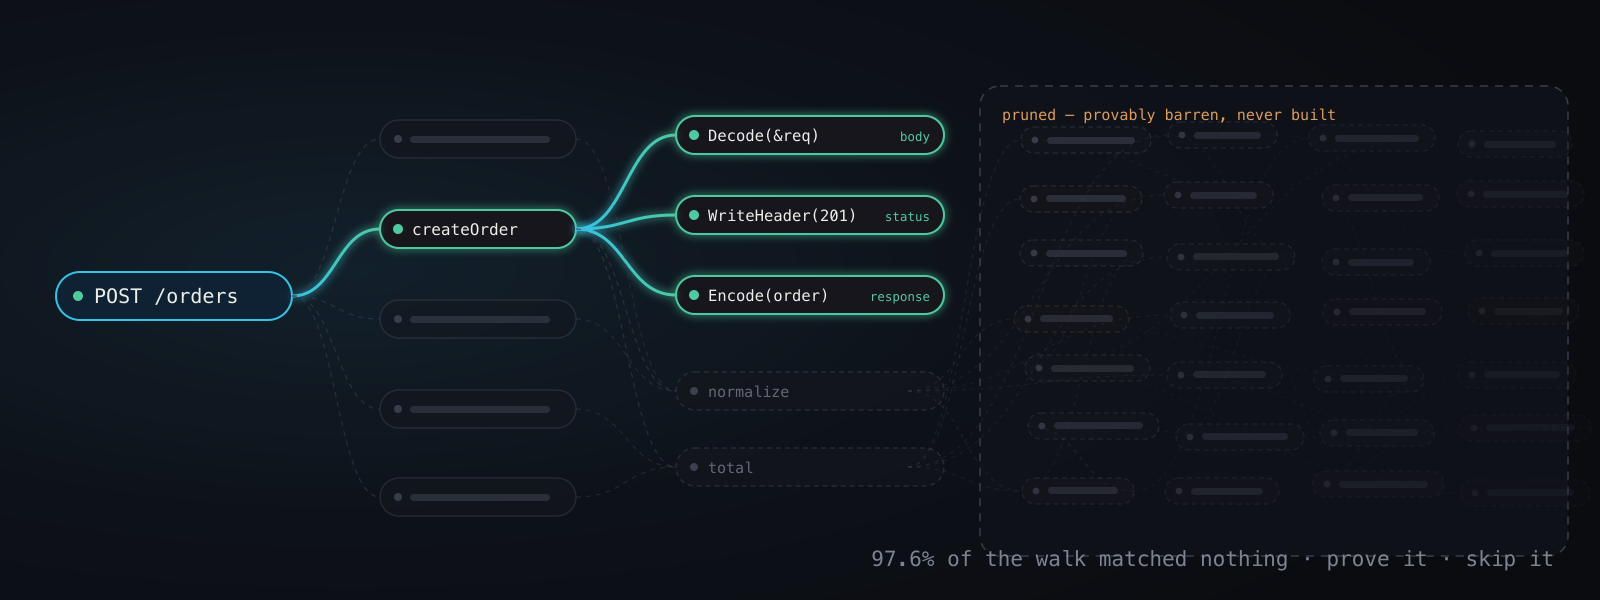
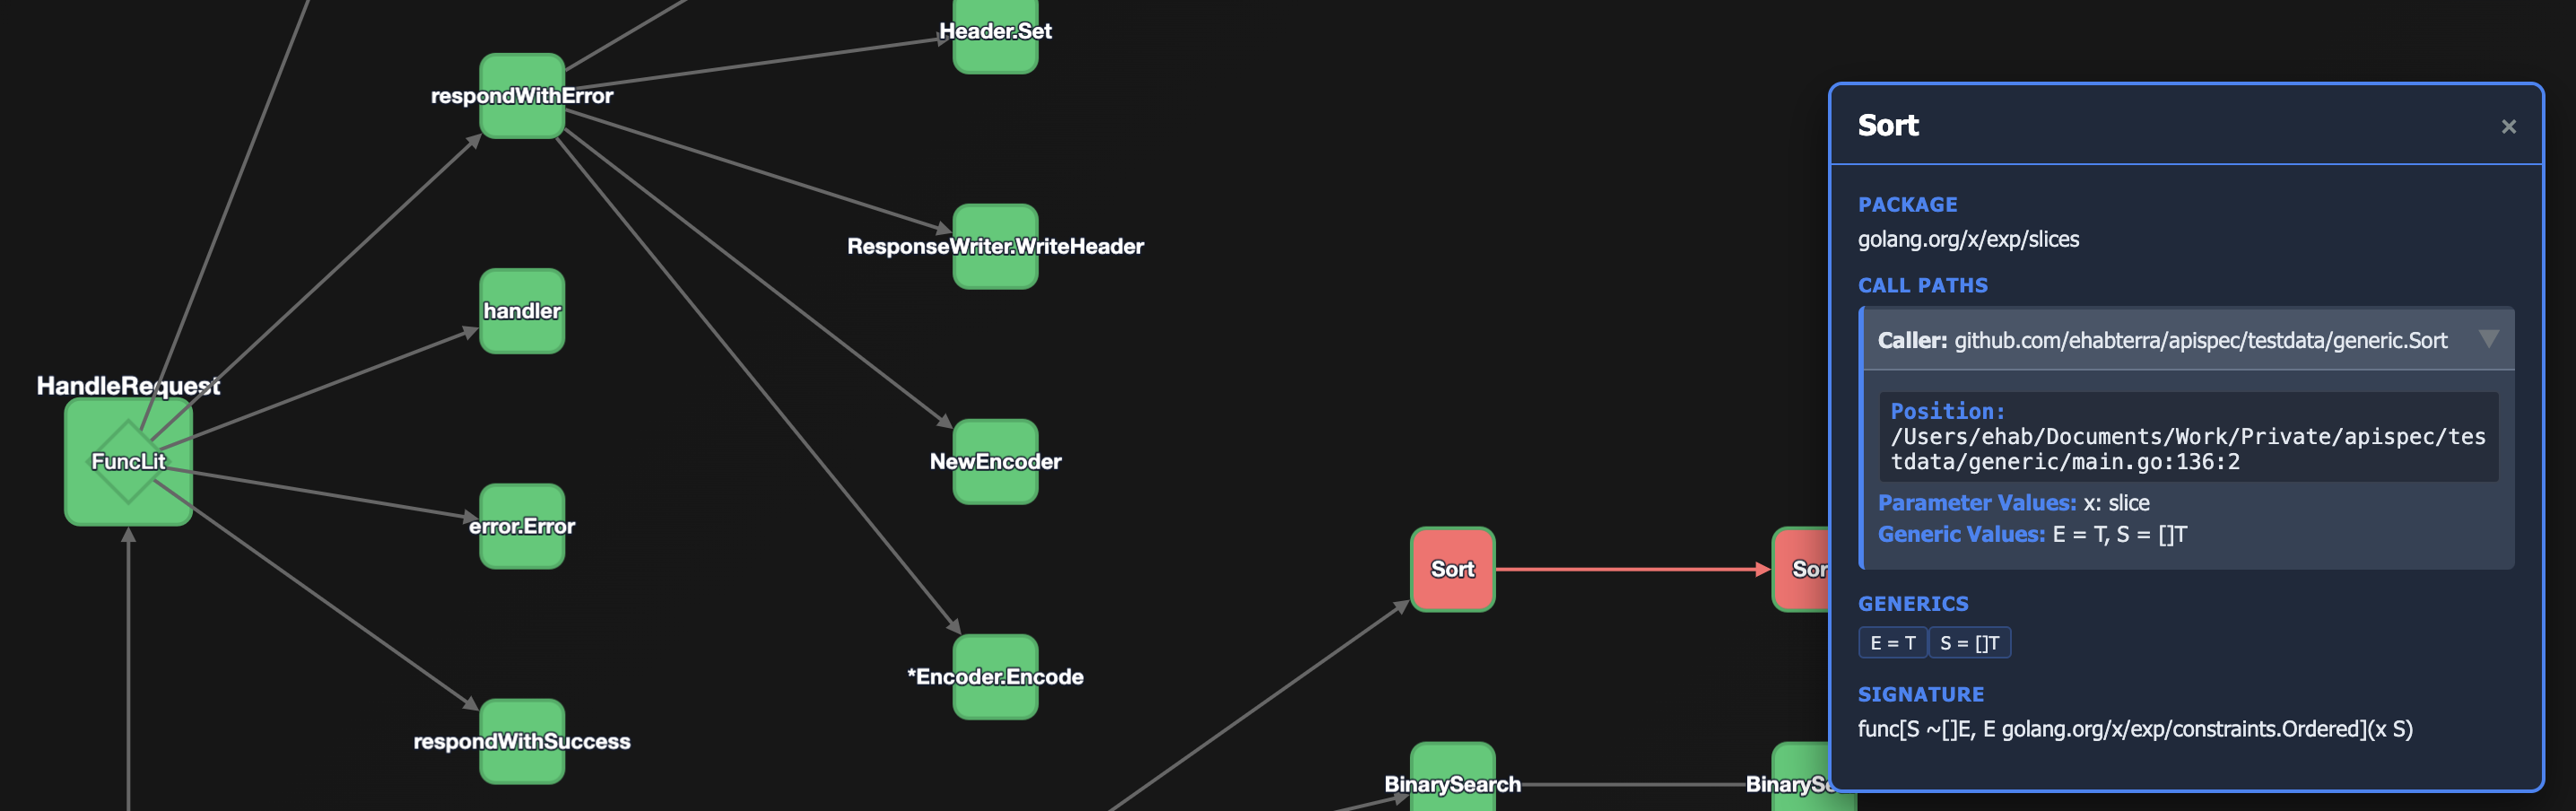
I maintain apispec, which reads Go source and generates an OpenAPI spec from it. On a small service it’s instant. On a 3,000-file module it expands a call graph until it hits a node budget, and then it prints the line I hate most:
[engine] expansion truncated at the 50000-node limit — the spec is incomplete
That’s the whole problem. Memory isn’t a vanity metric here — it’s the thing standing between a user and a complete spec. Raise the budget and you document more routes; raise it too far and the run takes 3 GB and several minutes. So when I noticed how many structs the analyzer was flagging for bad field ordering, it looked like free headroom. Same code, same behaviour, just fewer bytes per node.
It was free. It was also 2%. This post is about why, because the reasoning turned out to be more useful than the patch.
How Go lays out a struct
Go stores fields in declaration order and aligns each one to its own size. An int64 must start at an 8-byte boundary, so if the field before it ends at byte 1, the compiler inserts 7 bytes of nothing.
type Bad struct {
    a bool  // 1 byte + 7 padding
    b int64 // 8
    c bool  // 1 byte + 7 tail padding
} // 24 bytes

type Good struct {
    b int64 // 8
    a bool  // 1
    c bool  // 1 + 6 tail padding
} // 16 bytes
Same three fields, same types, 33% smaller. The rule is boring: put the wide fields first and let the narrow ones share a word.
You can check any type yourself:
unsafe.Sizeof(Bad{})  // 24
unsafe.Sizeof(Good{}) // 16
And you don’t have to hunt by hand — fieldalignment will:
go install golang.org/x/tools/go/analysis/passes/fieldalignment/cmd/fieldalignment@latest
fieldalignment ./...
It even has -fix. On apispec it reported 168 structs. At that point I was fairly sure I’d found something.
What I actually shipped
I reordered the types the pipeline allocates per node, per route and per argument:
| type | before | after |
|---|---|---|
LazyNode |
104 | 96 |
TypeRef |
136 | 128 |
RouteInfo |
360 | 352 |
LazyNode is the most numerous allocation in the program — one per node of an expanded call graph, millions on a large run. Two misplaced bools were costing 8 bytes each time.
Then I measured, and this is where I wasted the most time. Two obvious approaches are both wrong:
Peak RSS is too noisy. Repeat runs of the same binary differed by 250 MB. The effect I was chasing was smaller than the error bar.
Heap profiles are sampled. go tool pprof reported the node allocation site 0.9% higher after the struct got 8 bytes smaller. Sampling noise, nothing more.
What works is -benchmem, because B/op comes from runtime counters rather than a sampler:
go test -bench BenchmarkPipelineAlloc -benchmem -count=5
before   16,916,529 B/op
after    16,623,500 B/op
         -1.73%
Those are means of five runs each, with no overlap between the two distributions. allocs/op stayed at about 128,300 either way — the same allocations, each one slightly smaller. Real, reproducible, and much smaller than I wanted.
Why it was only 2%
My structs weren’t the textbook case. Bad above is 58% padding — a deliberately awful layout. Real structs in this codebase are pointers, strings, slices and maps, and every one of those is already 8-aligned. They never pad. Padding only shows up where a bool or a uint8 sits between them, and there were only a handful. LazyNode was 7.7% padding, not 33%.
The biggest allocator had nothing to give. CallArgument is the single largest allocation source in a run. I ran fieldalignment -fix on it and compared:
| type | current | optimally reordered |
|---|---|---|
CallArgument |
216 | 216 |
CallGraphEdge |
360 | 360 |
Call |
112 | 112 |
Not one byte. The analyzer does flag these, but with a different message — “pointer bytes could be…” — which shortens the region the garbage collector has to scan, not the memory you allocate. I’d been reading 168 findings as 168 opportunities. Most of them never had a byte in them.
Amdahl, as always. Node allocation was about 571 MB out of 5,680 MB in a run. Making nodes 7.7% smaller moves 7.7% of 10%, which is 0.8%. The measured 1.7% came out slightly better only because Go rounds allocations into size classes, so TypeRef at 136→128 actually crossed 144→128 and saved 16 bytes rather than 8.
And struct headers aren’t where the memory is. In the toy example the struct is the payload: [1000]Bad is 24 KB of pure struct. A LazyNode is a 96-byte header pointing at things it doesn’t own — interned strings, child slices, map buckets, loaded AST and type information. That’s where the gigabytes live, and field ordering can’t reach any of it.
One trap worth knowing
I couldn’t reorder about a third of the flagged structs at all, because field order is serialization order. Move a field in a struct with json/yaml tags and you change the output. I checked rather than assumed — swapping two fields in the spec’s root type:
type OpenAPISpec struct {
    Info    Info   `json:"info,omitempty"` // moved above OpenAPI
    OpenAPI string `json:"openapi"`
    ...
}
-{"openapi":"3.1.1","info":{...
+{"info":{"title":...
Every generated document changed shape. For a tool whose output people diff in CI, that’s a breaking change dressed up as a refactor. If a struct is serialized, its field order is part of your API.
The lesson
Work out the share before optimizing the item. “This struct is 7.7% smaller” and “the program uses 7.7% less memory” are separated by a factor I never checked until after the patch was written. Ten minutes with a profile would have told me the ceiling was about 1%, and I’d have made a different decision about how much effort to spend.
I still shipped it. It’s free, it’s permanent, it costs nothing at runtime, and there’s now a benchmark in the repo that makes the next person’s measurement honest. But it didn’t touch the problem I actually have. That one needs fewer allocations, not smaller ones — sharing the argument trees that get rebuilt once per call site, which is roughly a fifth of everything the program allocates.
Padding is real, and fixing it is close to free. Just don’t expect it to save you when your heap is mostly pointers to other people’s data.
The change and its measurements are in the repo if you want the details.