Pruning: Prove It Can’t Matter, Then Skip It
The whole problem, in one file
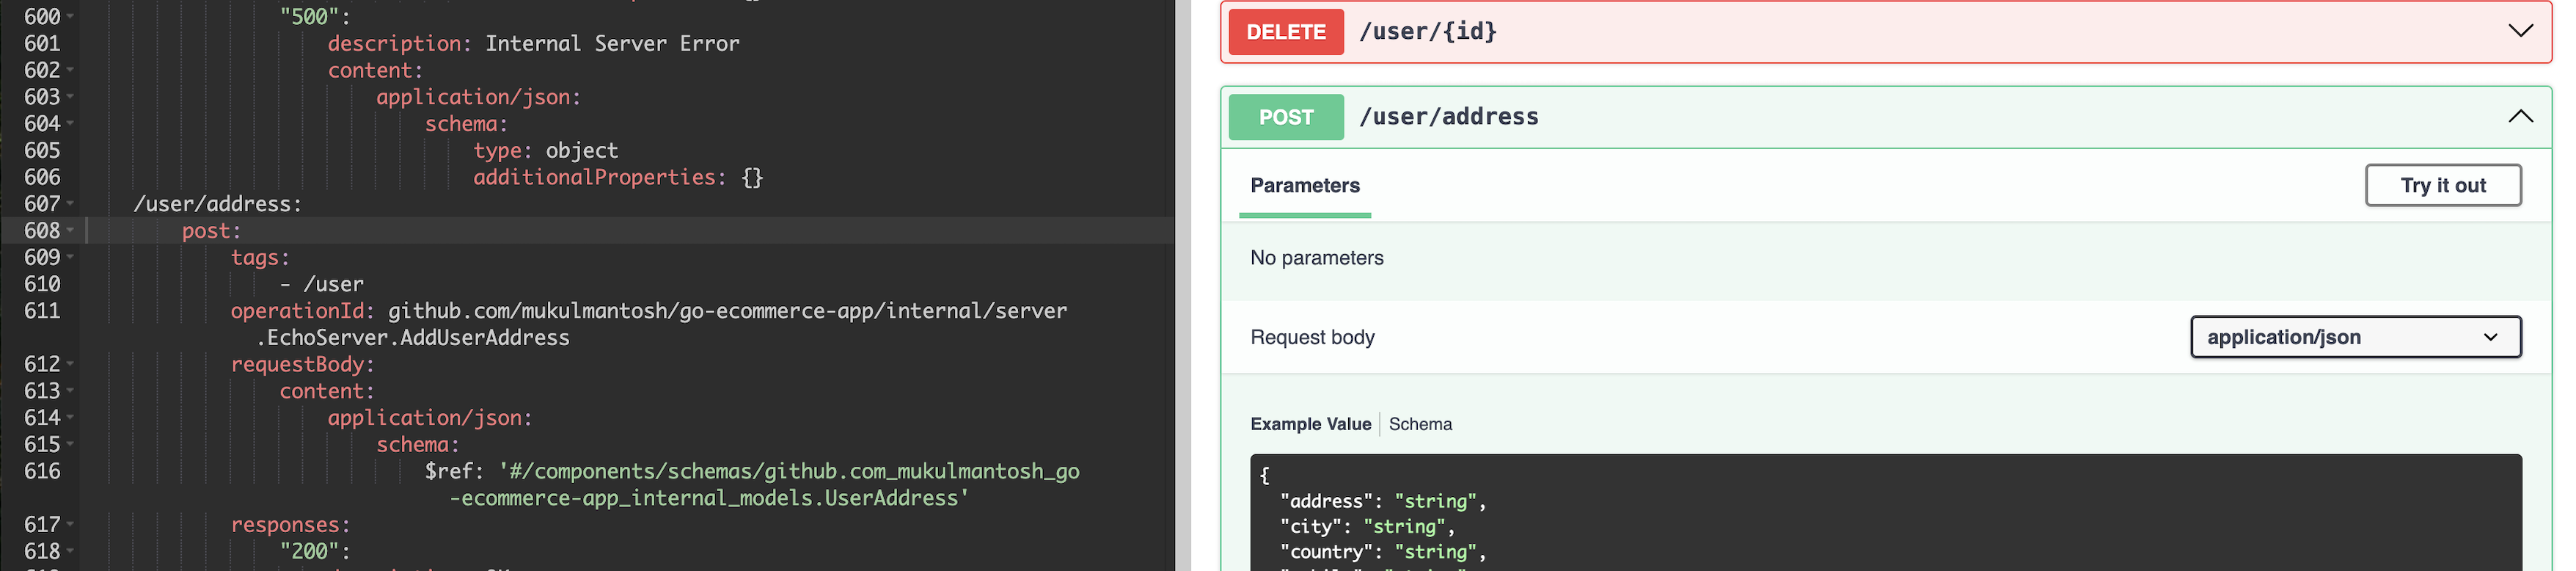
apispec reads Go source and writes an OpenAPI spec from it — no annotation comments, no swag init, just the code. Here is a program small enough to hold in your head. It is a real fixture in the repo, and it is the entire subject of this post:
func createOrder(w http.ResponseWriter, r *http.Request) {
	var req CreateOrderRequest
	_ = json.NewDecoder(r.Body).Decode(&req)

	order := Order{
		ID:    normalize(req.SKU),
		SKU:   normalize(req.SKU),
		Total: total(req.Quantity),
	}
	w.WriteHeader(http.StatusCreated)
	_ = json.NewEncoder(w).Encode(order)
}

func main() {
	mux := http.NewServeMux()
	mux.HandleFunc("POST /orders", createOrder)
	mux.HandleFunc("GET /orders", listOrders)
	_ = http.ListenAndServe(":8080", mux)
}
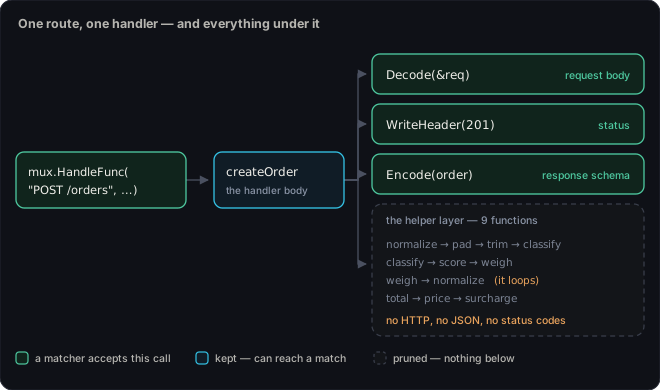
Four calls in there describe the API: HandleFunc gives the method and path, Decode gives the request body, WriteHeader gives the status, Encode gives the response schema. That’s the spec.
The rest of the file is normalize, pad, trim, classify, score, weigh, total, price and surcharge — string and arithmetic helpers, several of them mutually recursive:
// base cases elided
func normalize(s string) string { return trim(pad(s)) }
func trim(s string) string      { return classify(s) }
func classify(s string) string  { return score(s) } // or weigh(s)
func score(s string) string     { return weigh(s + "s") }

// and back to the top — the loop
func weigh(s string) string { return normalize(s[:len(s)-1]) }
Not one of them can contribute a byte to an OpenAPI document. There is no HTTP in there, no JSON, no status code. The tool walked all of them anyway — and on a real project, it walked them millions of times.
Where the millions come from
mux.HandleFunc("POST /orders", createOrder) tells you the method and the path and then stops. What the endpoint actually accepts and returns lives in the handler body, and in real code it is rarely right there — it’s behind a binding helper, a response wrapper, three layers of middleware. So the tool follows calls: start at the route registration, walk down through the handler, into whatever it calls, until something turns up that describes the API.
It builds that walk as a tree. Here is the design decision that cost me: the tree has one node per path, not one per function.
func handler() { a(); b() }
func a()       { helper() }
func b()       { helper() }
helper is reachable two ways, so it gets two nodes. Three callers, three nodes. That’s per layer, and the layers multiply — a helper five levels down under a mesh of small functions is reached along thousands of distinct paths and rebuilt once for each. weigh → normalize closes a loop, and a loop only stops when a budget stops it.
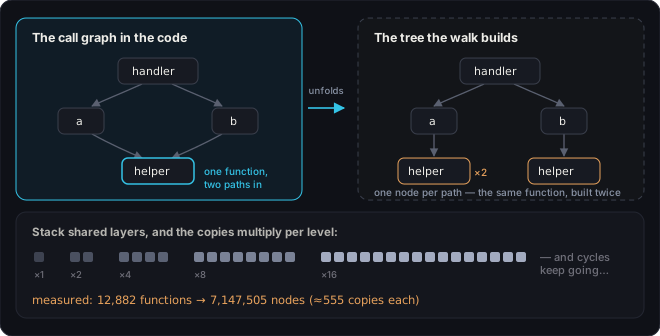
I knew this was wasteful. I did not know how wasteful until I put a counter in. On a 163-route service:
distinct functions the walk expands  =    12,882
nodes actually built                 = 7,147,505
nodes the extraction pass visited    = 7,103,742
nodes whose whole subtree matched nothing = 6,930,424  (97.6%)
nodes that ever matched anything          =   104,156   (1.5%)
7.1 million nodes built to consult 104 thousand. About 555 copies of the average function, and 97.6% of the tree is normalize and its friends.
And slowness was not the worst of it. The walk has budgets — a node cap per route, a cap on repeated copies of one callee — because without them a dense call graph expands forever. When a run hits a cap, it stops early and the spec quietly documents less than the truth. No error, no warning in the output file. Just an API document with things missing. Hold onto that; it comes back at the end.
The question a user asked me first
In September 2025 someone opened issue #20: a 23-endpoint Echo service, 67 packages, and apispec sat there for five minutes until they hit Ctrl-C. For scale, they noted that swag — the annotation-comment tool — scanned the same repo in about three seconds.
I gave them the two answers I had. Lower the caps: --max-nodes 5000 --max-recursion-depth 3. And exclude what isn’t API code: --exclude-package "**/internal/**". Their reply was one question — if the tool already knows the router, “why would I need to exclude anything?” Shouldn’t it just follow the code from the routes and visit only what matters?
Both my answers had been the same confession, and they’d caught it: the walk visits too much, and here are two knobs for rationing it. (Most of that particular freeze turned out to be cycle bugs in the walk, hunted down one by one over the releases after; those builds and today’s aren’t comparable.)
So I took the job back from them. Within a week --auto-exclude-tests and --auto-exclude-mocks were in, on by default, and ten days after the issue was opened I closed it saying the tool now “intelligently follows the code path.”
What those flags do is match names — drop a package whose path ends in _test, mocks, fakes, stubs, plus a few more variations of the same guess buried deeper in. Which misses in both directions at once. It never touched normalize and its friends: helpers named like helpers, 97.6% of the tree, all kept — the waste that user was actually waiting on is invisible to a name filter. And in the other direction it ate real API code, because production endpoints get named after what they do. A fake-door A/B test, a sandbox tenant, an indicative — “stub” — price quote: those handlers came out as documented routes with an empty body. It took me until August 2026 to notice and delete the worst of it — ten months in which no test ever failed.
So “no exclusions needed” was true only in the sense that the exclusions had moved somewhere nobody could see them. A guess inside a prune is how routes go silently missing — and that gap, between a prune that’s probably right and one that’s provably right, is what the rest of this post is about.
Their one question was the correct spec for the work. It would be a year before I met it — the releases in between went to security schemes, parameter coverage, better resolution, the rest of a tool that had more wrong with it than speed — and when I did come back, I reached first for the cheaper levers everyone reaches for.
Two cheaper fixes, measured
Make each node smaller. LazyNode is the most numerous allocation in the program, so I reordered fields to squeeze out struct padding — 104 bytes down to 96. That’s a whole post of its own, and the honest summary is: 1.7%. Field ordering fixes bytes-per-item. My problem was items.
Make the call graph smarter. apispec’s call graph is syntactic — it records what the source writes, so a call through an interface is recorded against the interface, not against the method that will actually run. The principled fix is a real call graph: SSA plus VTA, which golang.org/x/tools will build for you. I did that work in PR #250, and it produced a better graph inside a worse program:
- peak RSS on a large project: 3.15 GB → 4.62 GB (+46%)
- wall clock: +19%
- of 10,182 places the two graphs disagreed, only ~7,400 were safe to act on. The other 2,810 were ambiguous or unexplained, and acting on all of them would have rewritten 12% of the graph on the strength of a guess.
It still sits behind a --resolve-call-graph flag, off by default, because I set the memory gate before I measured and it failed. Precision is not speed. Quite often it is the opposite: a more accurate answer about more things.
One attempt bought 1.7%. One made it worse and added a class of bug I’d have to defend. What was left was the option issue #20 had pointed at all along: don’t build the nodes at all.
The property that makes skipping safe
Skipping needs a provable no, not a probable one — I’ll come back to what a wrong “no” costs. Here’s the proof, and it was already sitting in the codebase.
apispec finds things in the tree with matchers: small declarative patterns, one family each for routes, mounts, security, request bodies, responses and parameters. A response matcher for HTTP frameworks looks like this:
ResponsePattern{
	CallRegex: `^(?i)(JSON|String|XML|YAML|ProtoBuf|Data|File|Redirect)$`,
	StatusArgIndex: 0,
	TypeArgIndex: 1,
	TypeFromArg: true,
}
Every question in there is about one call: what is the callee named, what package is it in, what is the receiver, who is the caller, what are the arguments. Not one of them asks how we got here. That’s not an accident I discovered — the extractor documents it and already relies on it to memoise matchers per edge. Only extraction, which runs after a match, cares about a node’s ancestry.
Which means the question “is there anything under this function that a matcher would accept?” has the same answer no matter which path you arrive by. normalize matches nothing whether you reach it from createOrder, from listOrders, or through forty layers of middleware.
So I stopped asking it per node and started asking it per function: once over the ~12,900 distinct calls, instead of 7.1 million times over their copies.
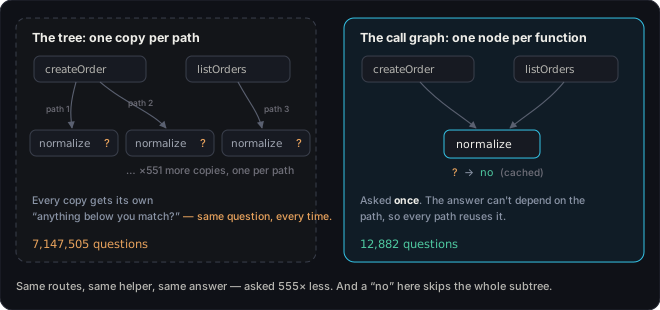
Roughly 555× fewer questions, before a single node is saved. If the move feels familiar, it’s the one hash consing makes: one answer per distinct content, not one per occurrence.
The predicate is “can reach”, not “matches”
This is the part I’d most want you to take away, because getting it wrong is silent.
The test is not “does this call match”. It is “can this subtree reach a call that matches”.
The difference is the entire safety argument. After a match, the extractor walks back up the tree to work out which route the match belongs to. If I dropped every node that didn’t itself match, I’d cut the ground out from under every match I kept. “Can reach a match” keeps every ancestor of every match automatically: if a node can reach a match, it is kept, and its parents can reach that same match, so they are kept too. Nothing a kept node can reach is ever pruned.
It’s the mark phase of a tracing GC run in the other direction — seed from the things you care about, keep the transitive closure.
To ask the question about a call before any node exists for it, the matcher gets a stand-in:
type edgeOnlyNode struct{ edge *metadata.CallGraphEdge }

func (n edgeOnlyNode) GetParent() TrackerNodeInterface     { return nil }
func (n edgeOnlyNode) GetChildren() []TrackerNodeInterface { return nil }
func (n edgeOnlyNode) GetEdge() *metadata.CallGraphEdge    { return n.edge }
Today every matcher reads only GetEdge(). Suppose someone later writes one that consults ancestry: through the stand-in it sees no ancestry, and since any such check is one more condition to satisfy, it can only match fewer calls than a real node would. Fewer matches means fewer prunes. The error falls toward keeping. I wouldn’t ship a prune where I couldn’t finish that sentence.
The maintenance hazard, stated plainly rather than left in a comment: the base predicate ORs across all six matcher families.
func (e *Extractor) edgeMatchesAnyFamily(edge *metadata.CallGraphEdge) bool {
	node := edgeOnlyNode{edge: edge}
	for _, m := range e.routeMatchers {
		if m.MatchNode(node) {
			return true
		}
	}
	// ... and mount, security, request, response, param
	return false
}
Add a seventh family and forget this function, and the prune starts dropping subtrees that family would have matched. Routes go missing from someone’s API docs, nothing errors, and the tool looks fine doing it. That’s the failure mode this whole design is arranged around, and it’s why the answer had to be provable rather than plausible.
The bug I nearly shipped: cycles
The obvious way to compute “can x reach a match” is a memoised DFS. In Go, roughly:
func canReach(f fn, memo, onPath map[fn]bool) bool {
	if v, ok := memo[f]; ok {
		return v
	}
	if onPath[f] {
		return false // cycle guard
	}
	onPath[f] = true
	res := matches(f)
	for _, c := range children(f) {
		res = res || canReach(c, memo, onPath)
	}
	onPath[f] = false
	memo[f] = res // ← the bug
	return res
}
Correct on a DAG — memoisation over an acyclic graph is ordinary dynamic programming. Wrong on a call graph, which has cycles all over it — weigh calls normalize right there in the fixture.
Take x → y, y → x, and x → match. The walk enters x, recurses into y, and y asks about x. x is still on the path, so the guard answers false. Fine as a guard; fatal as a cached answer. y records false permanently, even though y → x → match is a perfectly good path. Fixing it forwards means condensing the strongly connected components first (Tarjan’s territory) or repeating the whole pass until it settles.
So I ran it backwards:
- Walk forwards once to enumerate the functions, recording reverse edges (child → parents).
- Seed the reachable set with every function whose own call matches.
- Pop a reachable function, mark its parents reachable, push them. Repeat until the worklist is empty.
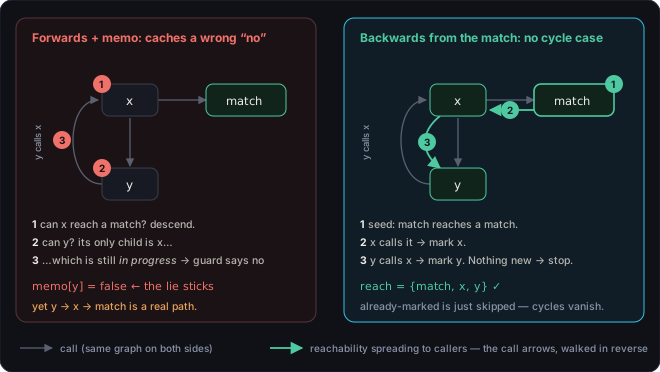
That’s the whole thing (real names shortened for the page):
func computeReach(
	roots []key,
	children func(key) []key, // the calls this call makes
	matches func(key) bool,   // does this call itself match?
) map[key]bool {
	reach := map[key]bool{} // the answer, per distinct call
	rev := map[key][]key{}  // child -> its parents
	seen := map[key]bool{}
	var frontier, seeds []key

	visit := func(k key) {
		if seen[k] {
			return
		}
		seen[k] = true
		frontier = append(frontier, k)
		if matches(k) && !reach[k] {
			reach[k] = true
			seeds = append(seeds, k) // seeds the backwards pass
		}
	}

	// Pass 1, forwards: enumerate every call, recording reverse edges.
	for _, k := range roots {
		visit(k)
	}
	for len(frontier) > 0 {
		k := frontier[len(frontier)-1]
		frontier = frontier[:len(frontier)-1]
		for _, c := range children(k) {
			rev[c] = append(rev[c], k)
			visit(c)
		}
	}

	// Pass 2, backwards: a parent of something reachable is reachable.
	for len(seeds) > 0 {
		k := seeds[len(seeds)-1]
		seeds = seeds[:len(seeds)-1]
		for _, p := range rev[k] {
			if !reach[p] {
				reach[p] = true
				seeds = append(seeds, p)
			}
		}
	}
	return reach
}
Both passes are linear, and there is no cycle case to handle — a node already marked reachable is simply never re-queued. The shape is textbook backwards dataflow analysis, the same direction liveness runs, and I only really trusted it once I recognised that. There’s a unit test pinning exactly the x → y → x graph, because this is the kind of bug that sails straight through every acyclic test you write.
What it bought
Mapping-stage times, minima of three interleaved pairs:
163-route service   6.06s -> 2.67s    nodes 7,147,505 -> 405,490  (-94.3%)
                                      peak RSS 1145MB -> 522MB    (-54%)
the apispec repo    6.58s -> 0.58s
2.3× on the service, 11× on the repo, and 94% fewer nodes. But the number I actually cared about is that on the 163-route service the generated spec is byte-identical, and deterministic across runs. The benchmark said it was fast; only the empty diff said it was right.
Then the diff wasn’t empty
On apispec’s own repo, the output changed. And it had only gained.
Remember the budgets. The unpruned baseline was exhausting its per-route node cap on 6 of 36 routes, and its instance cap was refusing 3,624,817 repeated call copies. Response bodies were silently missing from those routes, and had been for as long as anyone had run the tool on this repo.
Once the budget stopped being spent on normalize and friends, the walk reached the parts that mattered and the responses came back — 200 and 500 with real $ref schemas. The instance cap now refuses 509,218 copies instead of 3.6 million, and the per-route truncation warning disappeared from the 163-route service entirely.
I wanted to be sure this was convergence, not a differently-shaped truncation, so I raised both caps 20× on the pruned build: nothing changed. The same raise on the baseline didn’t finish in ten minutes.
That’s the effect I keep coming back to. When a system truncates under a budget, removing waste doesn’t just save time — it converts directly into output. “Faster and more complete” normally smells like marketing. Under a budget it’s arithmetic.
It’s also, finally, an honest answer to issue #20. The caps rationed and the name matching guessed; this is the tool doing what that user said it should have done from the start — follow the code from the routes and pay only for what can matter.
Run it yourself
The fixture from the top of this post is in the repo:
git clone https://github.com/ehabterra/apispec && cd apispec
go run ./cmd/apispec -d ./testdata/barren_subtree --output openapi.yaml
paths:
  /orders:
    post:
      operationId: example.com/barrensubtree.createOrder
      requestBody:
        content:
          application/json:
            schema:
              $ref: '#/components/schemas/example_com_barrensubtree_CreateOrderRequest'
        required: true
      responses:
        "201":
          content:
            application/json:
              schema:
                $ref: '#/components/schemas/example_com_barrensubtree_Order'
The nine helpers don’t appear, because they never could. What changed is that the tool no longer pays to find that out.
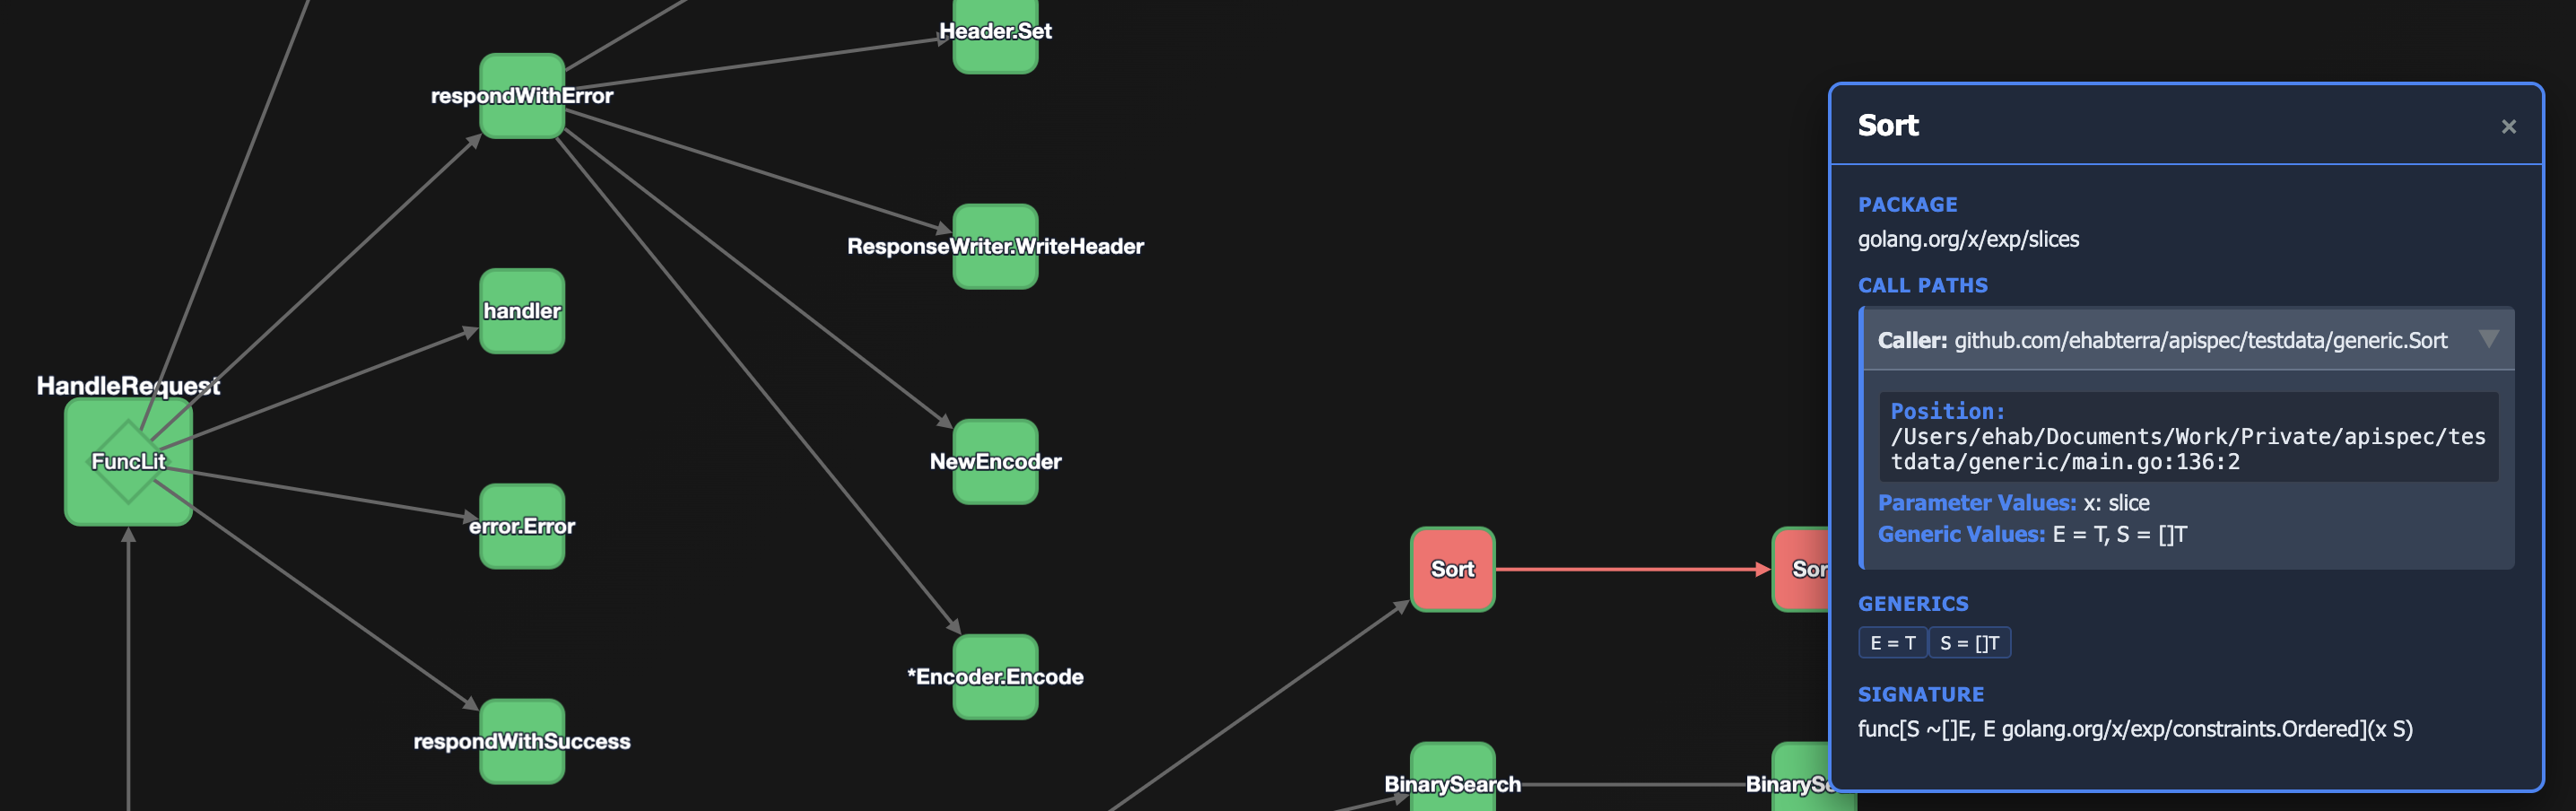
Both pictures below are that same fixture — the createOrder handler behind POST /orders, from the top of this post — in apispecui’s resolution trace, which will draw a route from either structure. The raw call graph first, every syntactic call out of the handler:
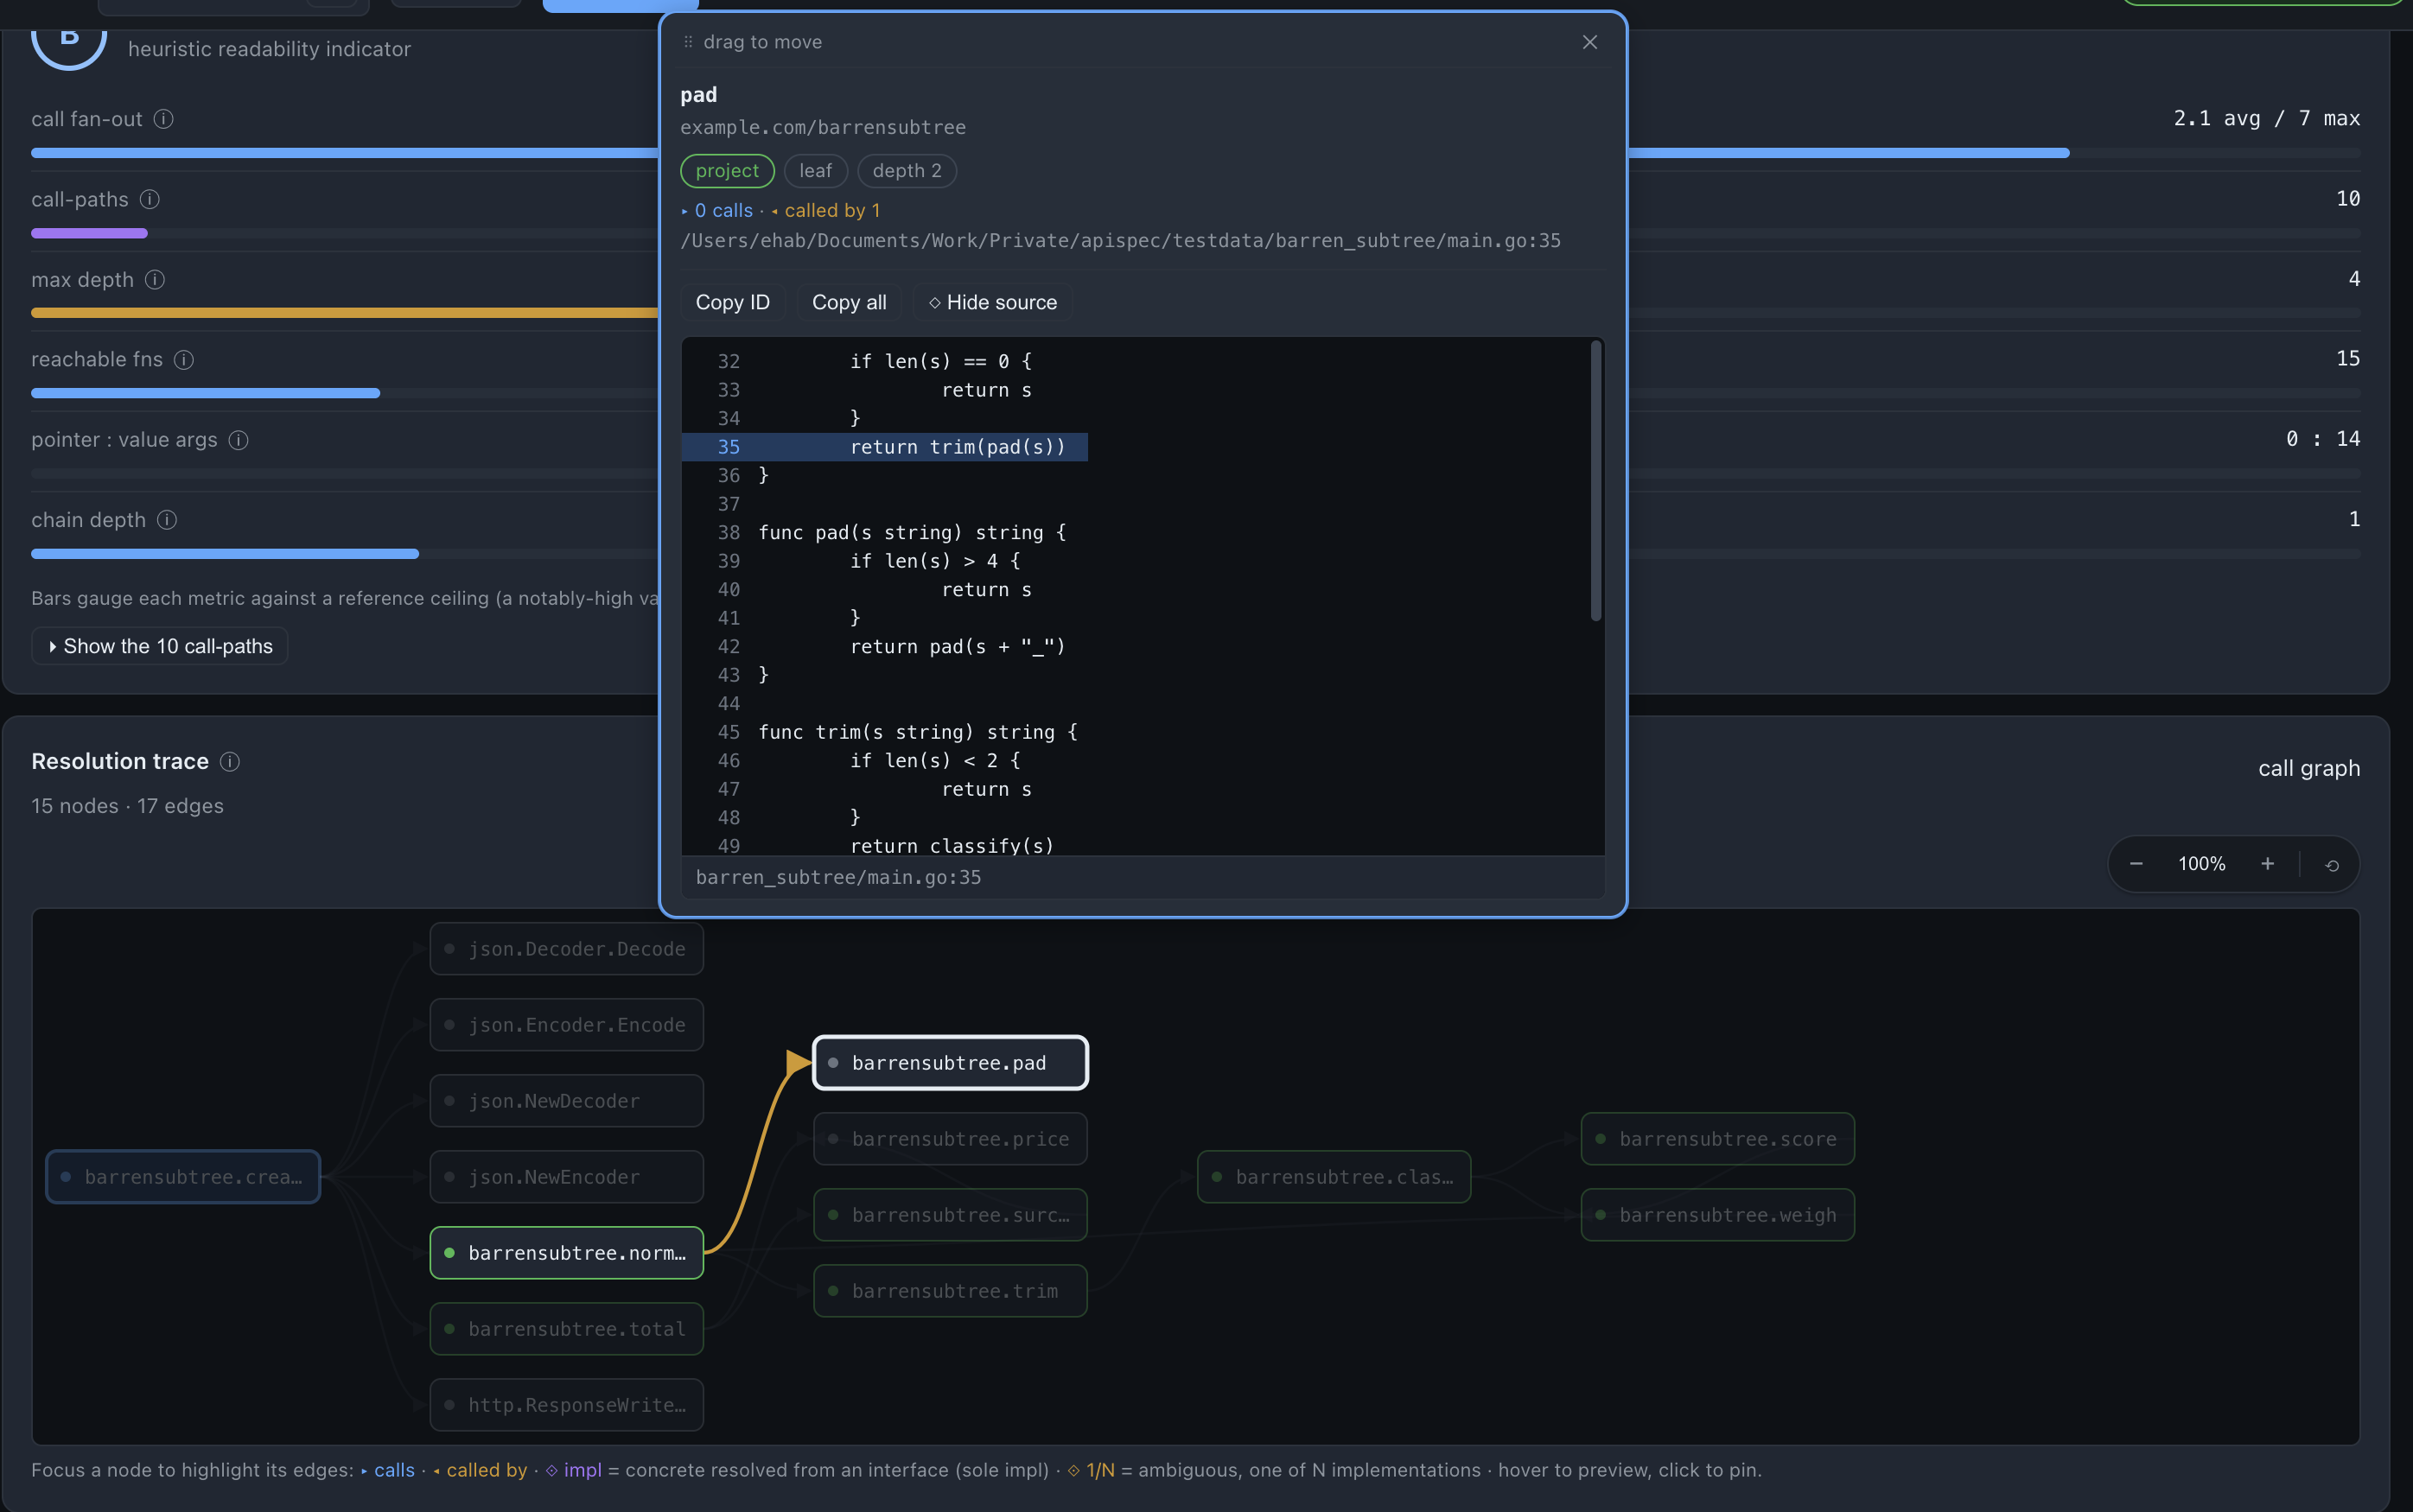
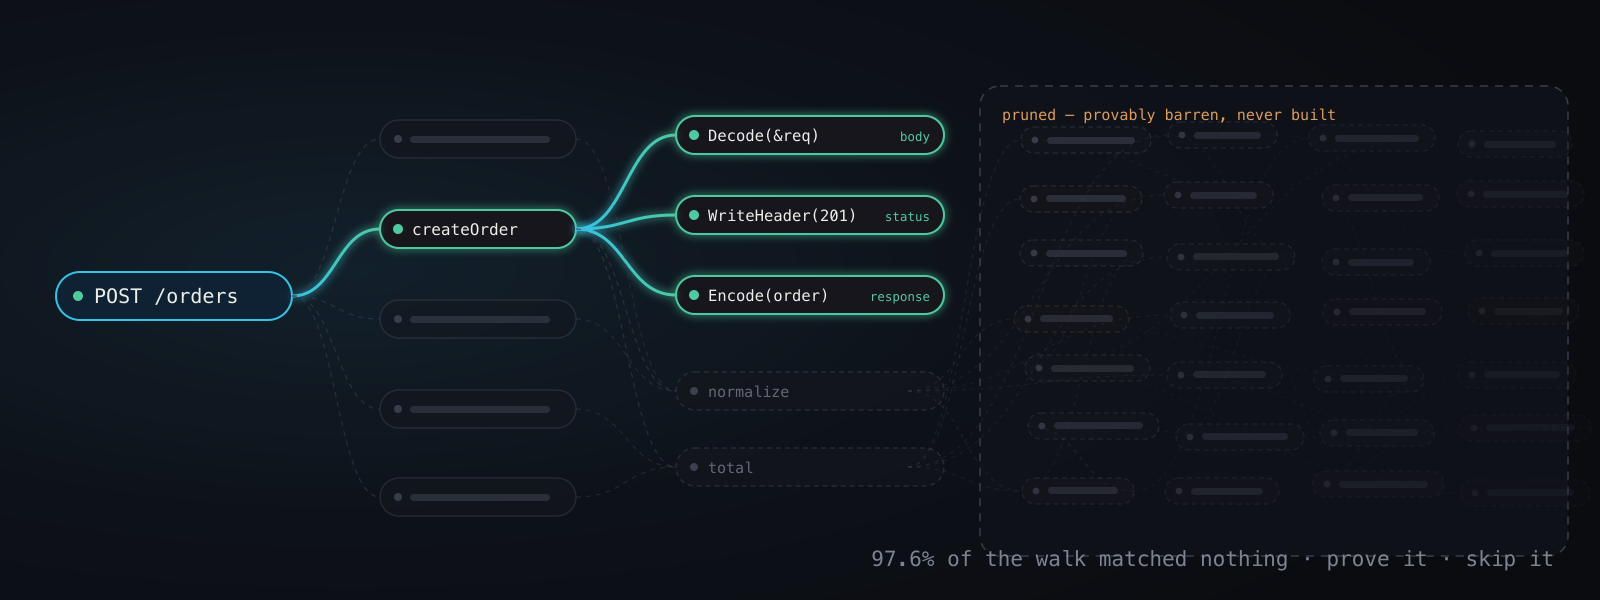
And the same handler again, as the tree apispec built:
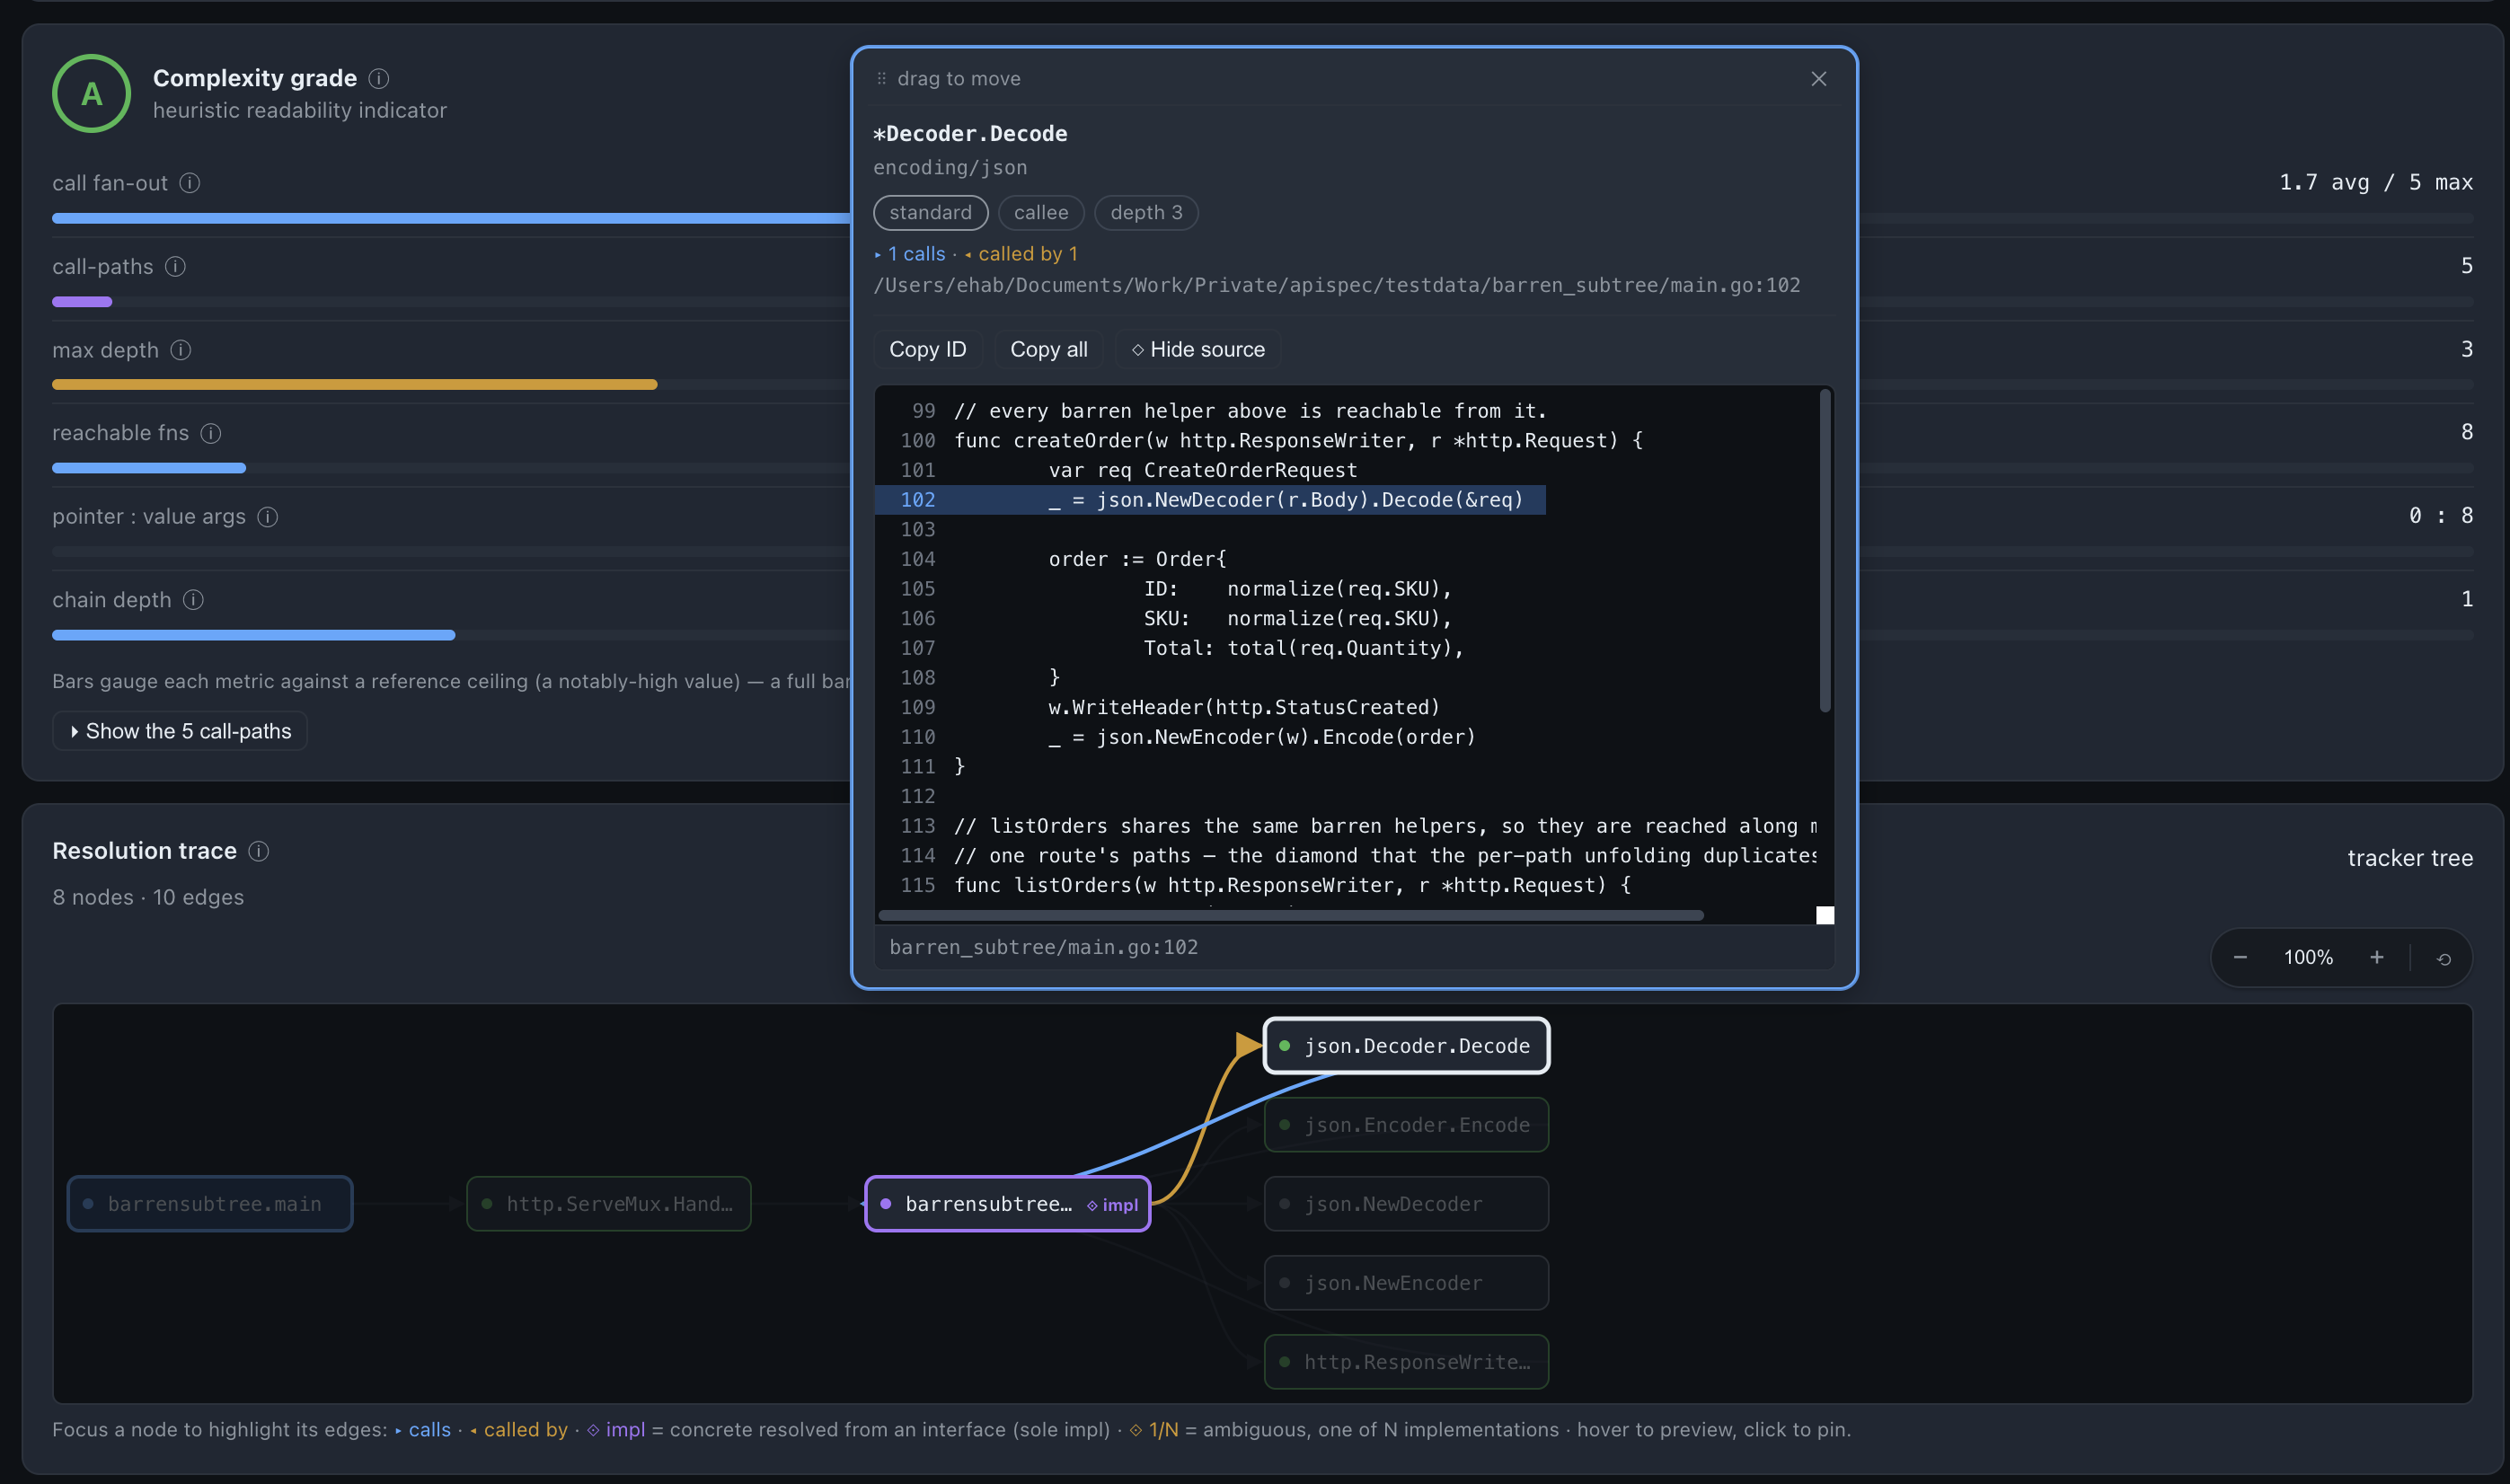
One handler, two pictures: fifteen nodes and seventeen edges become eight and ten. The handler’s five json and http calls survive intact — main and HandleFunc join them because the tree starts at the route registration, not the handler — and what’s gone is the nine helpers, with every edge among them.
That fixture is also the regression guard (PR #348): its output is identical with and without pruning, so it’s a change detector rather than a test of the speedup. If a future edit to the predicate ever eats a route, it fails loudly. And the prune has an off switch that costs nothing — a nil predicate is the default, and canReachMatch then answers true unconditionally, so anything wanting the full tree (the diagram server, which never runs the extractor) is untouched.
Where the prune runs out
One honest limit before the lessons: on a big enough codebase, the prune saturates. Pointed at gitea — 374 packages, 82,125 call edges — the walk still builds 15.7 million nodes (issue #389), because gitea funnels every JSON decode through its own modules/json wrapper, so nearly every subtree genuinely can reach a match and the predicate degenerates to keep-everything.
And to be clear about what the prune did not change: survivors are still built once per path, because a node’s meaning is path-dependent even when its match-answer isn’t — which route it serves, which argument values and generic type parameters flowed in.
The barren class was the part you could remove for free; what’s left is duplication of useful subtrees, and cutting those copies silently drops responses — a status write and its body are paired by the path that reaches them. Making that pairing path-free is #389, and a post of its own.
The runtime experiment, measured
With 15.7 million nodes still standing on gitea, the third tempting non-fix comes back into play: wait for the Go runtime, which has been getting faster at exactly this kind of heap. Like the other two, it deserved measuring rather than trusting.
Go 1.26 turned on the Green Tea garbage collector by default — it marks and scans small objects in contiguous 8 KiB spans instead of one at a time, and the release notes expect a 10–40% cut in GC overhead for GC-heavy programs. Go 1.27 added size-specialized allocation for objects under 80 bytes, up to 30% cheaper. Millions of small nodes on one heap is squarely what both were written for — except that LazyNode was exactly 80 bytes at the time, one byte the wrong side of that threshold, so what follows tests Green Tea and not the allocator.
Same commit, both toolchains, runs interleaved, on gitea:
toolchain    mapping (run 1 / run 2)    peak RSS
go1.26.0     1m35.8s / 1m38.1s          4.50 / 5.13 GB
go1.27.0     1m34.9s / 1m35.7s          5.01 / 5.71 GB
About 1.5% faster — inside the noise — and peak RSS higher, not lower.
Which agrees with everything GC tuning had already said. At GOGC 100, 300 and 600 the run was flat (13.7s / 13.7s / 14.1s) while RSS climbed 1.35 → 1.80 GB, and on the 163-route service GOGC=off was actually slower (8.3s vs 6.3s). The heap isn’t churning; it’s live — millions of nodes retained at once, because each node caches its children for the life of the walk. A collector can only trade against garbage, and there isn’t any.
So I took the byte off myself. Interning the node key to an int32 handle (PR #418) brought LazyNode to 72 bytes — a whole size class down, and on the right side of that threshold at last. It bought 7.5% off the mapping stage and 4.4% off peak RSS, output byte-identical.
Three passes at making the item cheaper, then: field ordering, a newer runtime, a smaller key — 1.7%, 1.5%, 7.5%, and the node count sitting exactly where it started at 15.7 million. The runtime makes each node cheaper. So does a smaller node. The lever is, and stays, the count.
What this taught me
- The best problem statement was sitting in my own issue tracker. A user asked in one sentence for the thing I would not build for another year. My first answer was configuration, my second was a guess at package names. When your answer to “why is it slow” is a knob, the knob is usually an apology for an algorithm.
- Count distinct versus copies before optimising anything. I guessed “a lot of waste”. The counter said 97.6% barren against 1.5% useful, and that ratio is what justified the work — and pointed at the walk itself rather than the cost of a node.
- A smaller item doesn’t fix a count problem. Padding was free and permanent and worth 1.7%; interning the node key took another size class off for 7.5%. A faster runtime is the same lesson, just outsourced: Green Tea and cheaper mallocs shave constants off work that shouldn’t exist. Wrong axis, every time.
- A more precise answer is not a faster one. SSA+VTA gave a better call graph for +46% memory. Sometimes the win is doing less, not doing better.
- Name the property that makes skipping safe, out loud. Here it was “matchers read only the call edge”. Finding it was the actual work; the loop that exploits it took an afternoon.
- Say which direction your approximation errs. Anything the stand-in withholds can only cause keeping, never dropping. If you can’t finish that sentence, you’re shipping a heuristic that loses data on a delay — which is exactly what my name-matching auto-excludes had been doing.
- On a cyclic graph, seed from the goal and go backwards. The forward memoised DFS was my first draft, and its premature cached negatives would have been the quiet kind of production bug.
- Under a budget, saved work is found output. That’s where the extra spec content came from, and I didn’t see it coming.
- Every fix has a scale where it stops. On gitea, “can reach a match” is true nearly everywhere and the prune degenerates to keep-everything. Measuring where your own fix saturates is the first step of the next one — #389 is that measurement.
Further reading
If any of the names below are new, there’s a companion page with a paragraph on each — what it is, and where it shows up here. The references themselves:
- DAGs versus cycles — the whole cycle trap in two links: memoisation is safe over a directed acyclic graph and unsafe over a cycle. Collapsing strongly connected components gets your DAG back, and Tarjan’s algorithm (“Depth-first search and linear graph algorithms”, SIAM J. Computing 1972) does it in a single DFS.
- Worklist fixpoints — the propagate-until-nothing-changes loop goes back to Kildall, “A Unified Approach to Global Program Optimization” (POPL 1973); the theory underneath is the least fixed point of a monotone function (Knaster–Tarski).
- Backwards dataflow — data-flow analysis in general and live-variable analysis in particular: if you’ve written liveness, you’ve written this post’s core loop. Chapter 9 of the Dragon Book is the standard treatment.
- Keep what can reach the goal — the mark phase of tracing garbage collection (the book is Jones, Hosking & Moss, The Garbage Collection Handbook), and program slicing (Weiser, “Program Slicing”, ICSE 1981 / TSE 1984).
- One answer per distinct content — hash consing, the persistent cousin of plain memoization.
- Call-graph construction (the PR #250 detour) — the precision ladder runs CHA (Dean, Grove & Chambers, ECOOP 1995) → RTA (Bacon & Sweeney, OOPSLA 1996) → VTA (Sundaresan et al., OOPSLA 2000); Tip & Palsberg (OOPSLA 2000) compare the ladder end to end. golang.org/x/tools/go/callgraph has the Go implementations, built on SSA form (Cytron et al., TOPLAS 1991).
- Honest over-approximation — In Defense of Soundiness: A Manifesto (Livshits et al., CACM 2015): every real analyser over-approximates somewhere, and the sin is not saying where.
- The runtime side — the Green Tea garbage collector, and the Go 1.26 / Go 1.27 release notes the measurements tested.
The implementation is internal/spec/prune.go, with the soundness argument in the doc comments — issue #318, PR #348. The sequel — what’s left after the prune, and why it’s harder — is issue #389.